


As Australia grapples with another COVID crisis, we’re once again placed on high alert. What started as a breach from hotel quarantine in NSW has now spread to five other jurisdictions, with most places increasing their level of restrictions in response.
Victoria is again in lockdown, for at least five days. South Australia has only reduced household visitor caps and outdoor gathering limits. Queensland has introduced stay-at-home orders to ensure the outbreak gets under control.
How do we measure if people are following the orders, and, perhaps more importantly, whether they’re having any effect?
The power of restrictions
In most Australian jurisdictions, broad-scale restrictions (usually called lockdowns) have become part of the standard outbreak response.
Beginning in March 2020, and see-sawing on and off ever since (particularly in Victoria), restrictions and lockdowns are now a part of life.
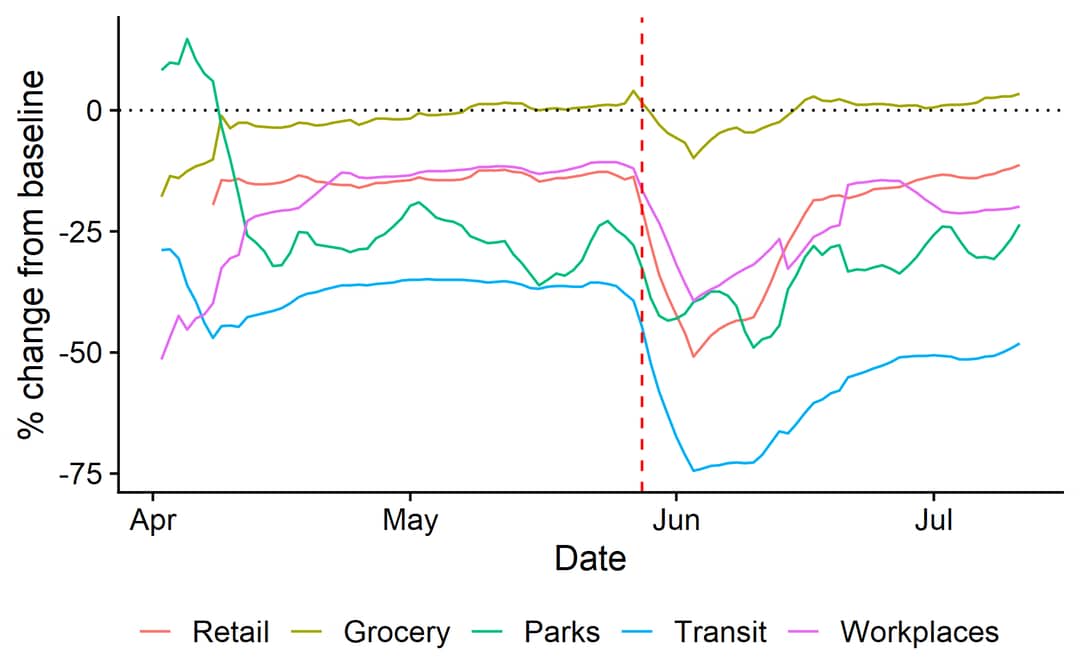
Although the side-effects of restrictions are high, adherence, measured through mobility data, shows just how strong the response has been, with journeys taken on public transport dropping as much as 75% in some Australian areas every time the lever is pulled.
To quantify precisely how that translates to a reduction in transmission, we calculate the effective transmission number, or Reff.
The effective transmission number, or Reff
One of the most highly-cited numbers in the Australian pandemic response, the effective transmission number (Reff) represents how many cases on average a single person will infect.
For example, a Reff of 2 means that five cases become 10, then 20, and 40. Comparatively, a Reff of 0.5 means the reverse: 40 becomes 20, then 10, five, and then three.
The value of Reff depends on many things – the biology of the disease circulating, how many people are susceptible to it, and, of course, how many people everyone is interacting with.
Methods for estimating Reff are reasonably well-established, with most relying on the renewal equation, which assumes people are mixing homogenously, and that cases in the future depend on cases today and the value of Reff. The critical number for Reff is 1 – above that, cases will grow; below it, they’ll shrink.
Reff has been estimated weekly in Australia, and reported by the Commonwealth government as part of the “Common Operating Picture” found here, with the latest estimate (as at 8 July) saying that the Reff in NSW is between 0.41 and 1.48.

There are two issues with using the Reff as a measure of outbreak response.
First, there must be active COVID cases for Reff to be estimated – an issue that’s a good one to have.
Second, it can only tell us about what transmission was like about a week prior, and in a situation that evolves as quickly as the coronavirus response, a week is a long time.
These issues are a real problem for decision-makers who need to know when a new outbreak starts, and whether the situation is likely to get worse or not. Enter the transmission potential, which, as the name suggests, quantifies the potential for transmission.
The transmission potential uses data that’s more current and frequently available to parameterise a model to predict what the effective transmission number would be, if a case were to be seeded in a given population.
A technical report can be found on the Doherty Institute website that fully outlines the method.
Importantly, the transmission potential for every state in Australia is above 1, before any adjustments due to the current variants of concern that are circulating. This in effect means that every state has the potential for an outbreak just like NSW is experiencing.
Why is control so much harder now?
Victoria’s most recent lockdown, and the current situation in NSW, have both seen extensions of restrictions. In the Victorian situation, a handful of new cases just kept trickling in. In the NSW situation, daily numbers have increased despite the strengthening restrictions.
Press conferences have been filled with references to the “Delta variant”. This evolution of COVID-19 is believed to be 40% more infectious than the “Alpha” variant (previously known as B117 or the “UK strain”), which itself is approximately 40% more infectious than what was circulating last year (known as the “wild type”).
There’s also emerging evidence suggesting transmission can happen slightly faster than wild type, making control even harder.
Read more: Victoria’s COVID-19 lockdown: Getting ahead of the spread
The common operating picture outlines the difficulty of the situation. In NSW, the transmission potential for wild type is close to 1. For Delta, it’s close to 2. This means that instead of cases trickling along, they’ll double every generation.
In Victoria’s extended stage four lockdown in 2020, Reff decreased to as low as 0.59. Applying the increased infectiousness from the Delta variant, Reff would be slightly above 1.
Not only does this mean control may not have been achieved, but it also means cases would have taken many times longer to decrease. The Delta variant really has changed the game.
Where to from here?
With the country experiencing outbreaks across several states, it’s hard to predict exactly what will happen next.
It appears NSW is having difficulty achieving control, and mobility data is suggesting the general population is experiencing some pandemic fatigue.
Zero COVID is still the policy across the country, and restrictions remain our best tool to do that. However, with Reff being close to 1 even under the strong restrictions, it seems like it could be a long and bumpy road back to zero.


