

Today marks the release of the sixth version of the United Nations’ assessment report on climate change. This is the first full assessment report focusing on our physical understanding of climate change to be released since the Paris Agreement was ratified almost five years ago.
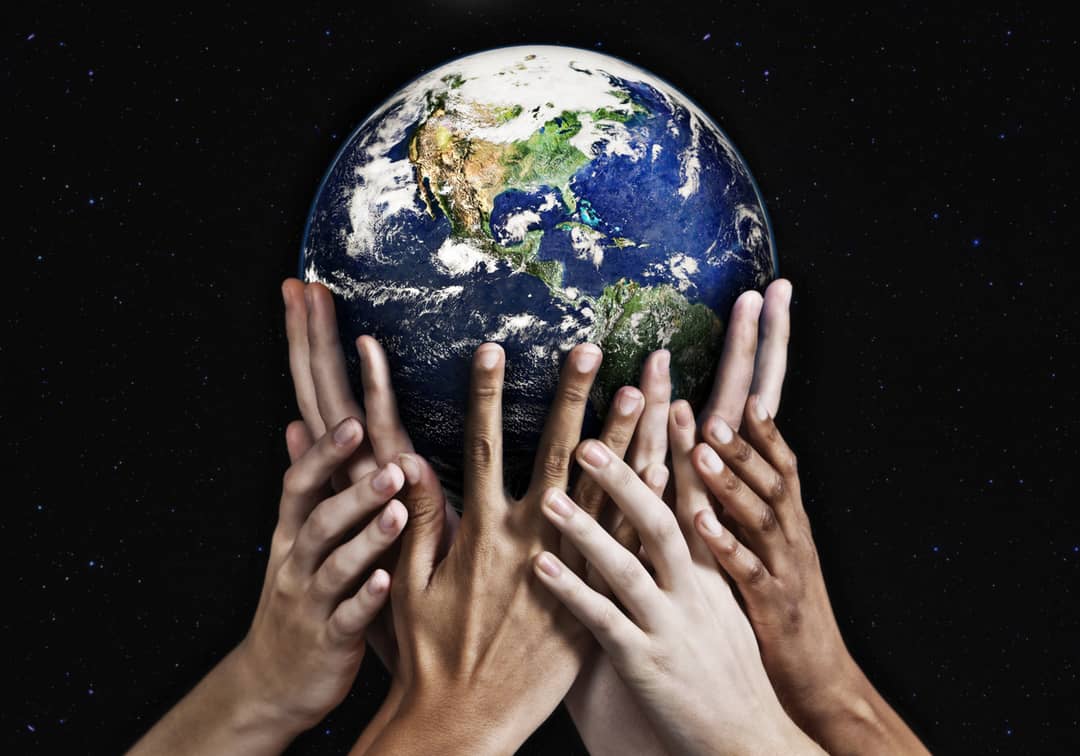
The Paris Agreement symbolised international governments joining scientists to agree that humans are responsible for recent climate change (191 of 197 member countries have now signed the agreement).
The agreement was reached to “limit global average temperature to well below 2°C above pre-industrial levels, and to pursue efforts to limit the temperature increase to 1.5°C above pre-industrial levels”, as it was recognised that limiting warming would significantly reduce the risks and impacts of climate change.
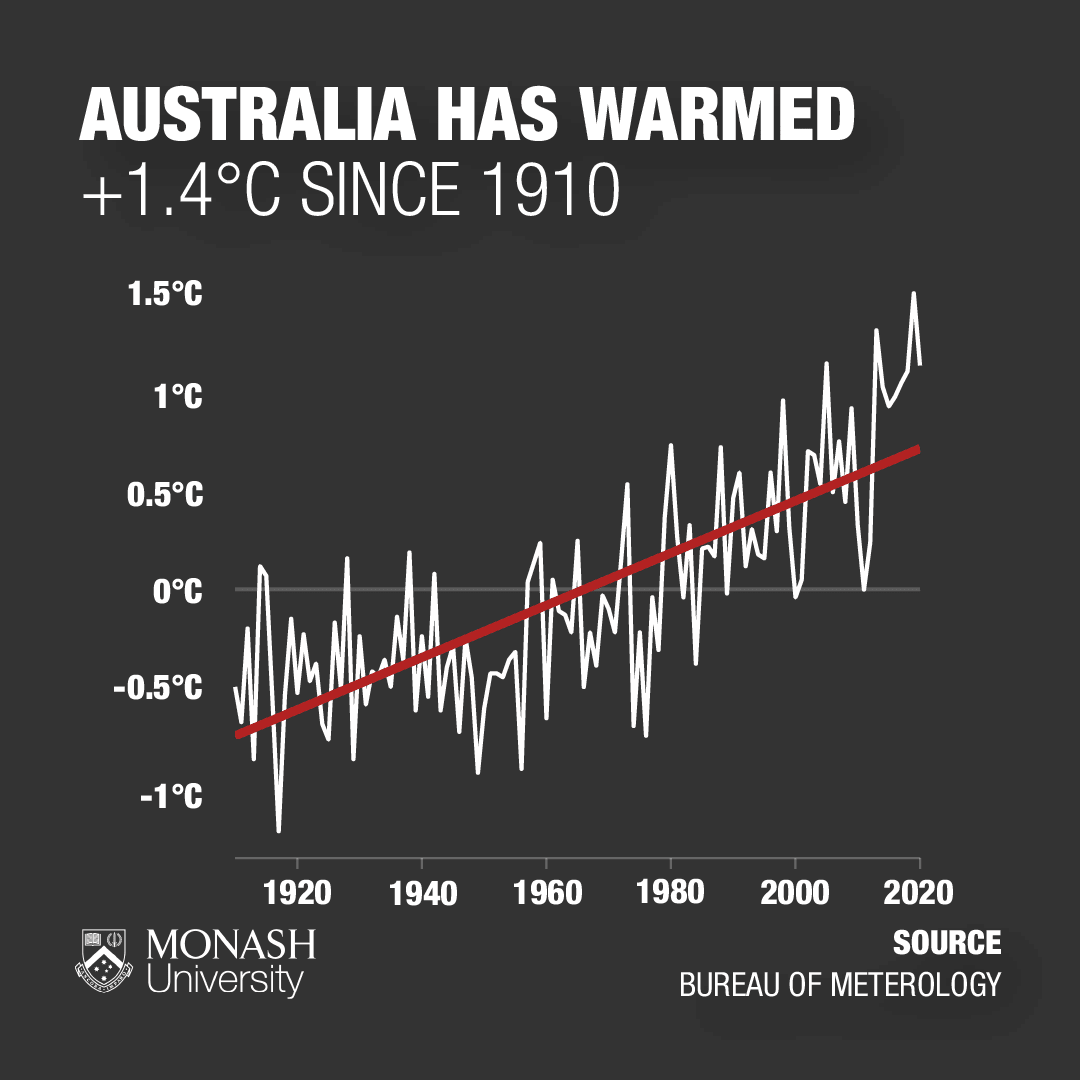
However, in a clear sign that acknowledging the problem is a long way from solving it, 2020 was one of the three warmest years on record (2016 is the warmest year on record), while the past six years, 2015-20, were the six warmest years on record.
These Intergovernmental Panel on Climate Change (IPCC) reports are written by scientists to provide a current and accurate assessment of our physical understanding of the climate system and climate change.
They do this by bringing together the latest advances in climate science, while also combining evidence from paleo-climate, observations, process understanding, global and regional climate simulations.
The current report includes 12 chapters, which allows it to outline globally and regionally-relevant information, along with an interactive atlas that allows users to analyse and plot the data featured in the report.
This latest report was written by 234 scientists, from more than 60 counties. It includes citations to more than 14,000 scientific publications, and was reviewed by climate experts and governments from around the globe to ensure its accuracy.
How much can really change in the seven years?
Firstly, we’ve seven years’ more scientific understanding to incorporate. Given that thousands of scientific papers dealing with climate change attribution and understanding are published every year, this a huge amount of new knowledge.
Secondly, we have seven years’ more observational data to work with. This is important, as our observational records of things such as sea surface temperatures in some regions are relatively short, but it’s also been a period where the climate system has displayed many rapid changes.
Thirdly, this report focuses on a new generation of climate models that have better spatial resolution, and include more important processes, cycles and climate system interactions.
Further, the report has a new structure that provides more integrated knowledge and understanding in comparison to the previous report.
In the previous report, there were separate chapters on the assessment of models, observational evidence, paleo-climate records etc, but now these topics are integrated in single chapters.
For instance, I worked on chapter three – the human influence on the climate system, which incorporated all these to assess the role of humans in past climate changes.
Focusing on the main outcomes of chapter three, the chapter to which I contributed, I believe the most important outcomes are:
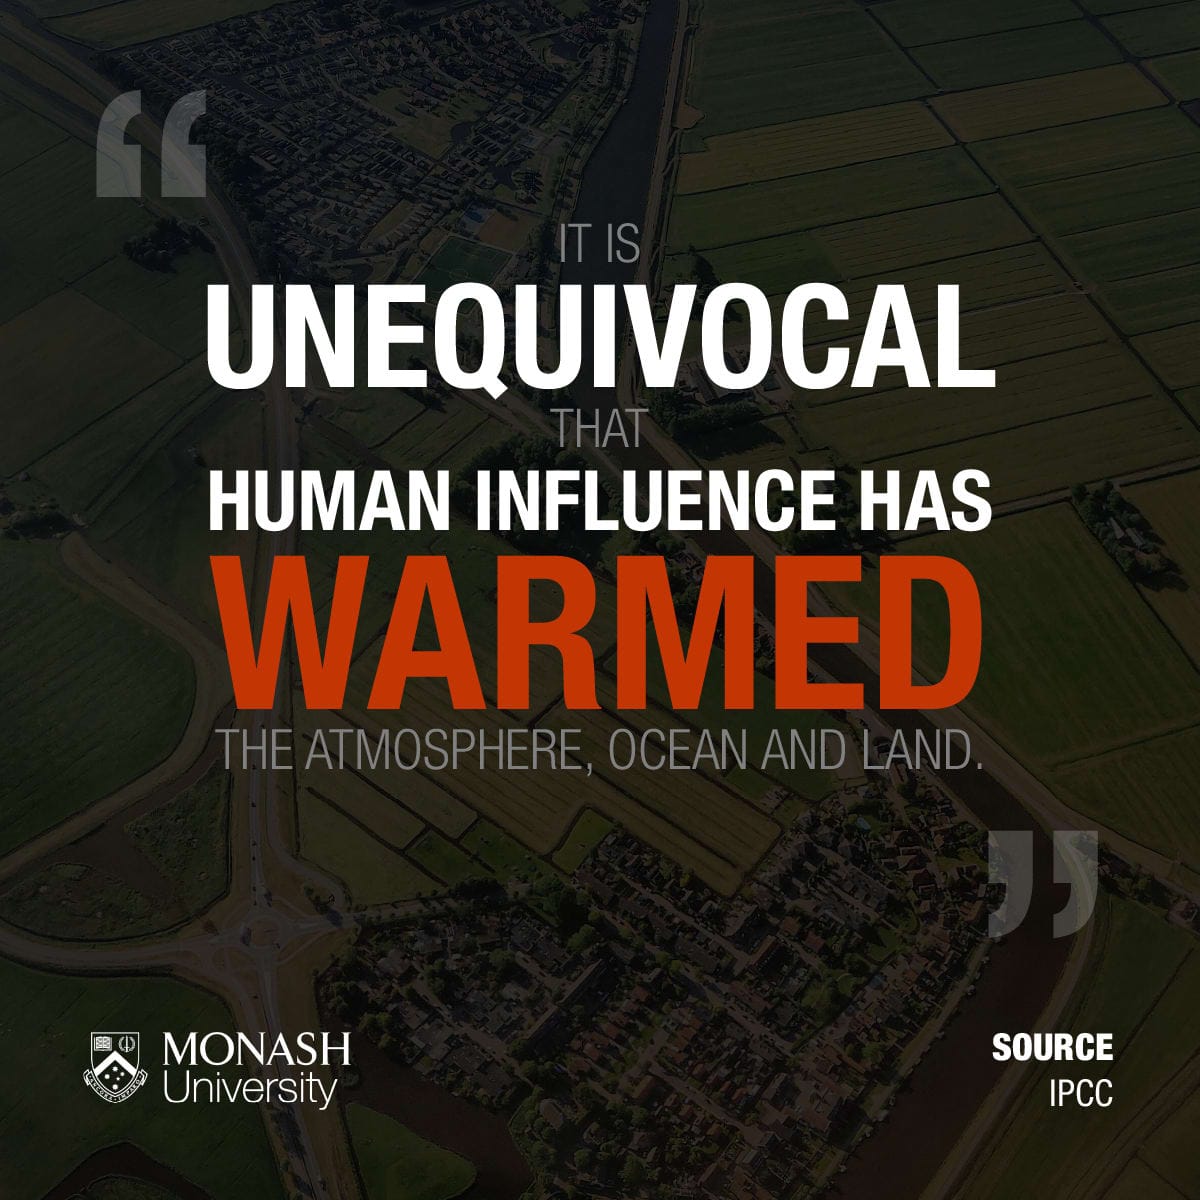
- That human influence has unequivocally warmed the climate system since pre-industrial times. This is an increase in confidence of the human influence from previous reports.
- That human activities have led to current atmospheric greenhouse gas concentrations that are unprecedented in the past two million years.
- That the likely range of human-induced global surface warming in 2010-19 (0.8-1.3°C), relative to 1850-1900, encompasses the best estimate of global surface warming (1.07°C) observed over this period.
Human influence has also been detected in many more regions. These include:
- regional land temperature extremes, where regional temperatures extremes have become more frequent, while cool extremes have become less frequent
- rainfall extremes, where the frequency and intensity of heavy precipitation events have increased over most land areas with sufficient available data
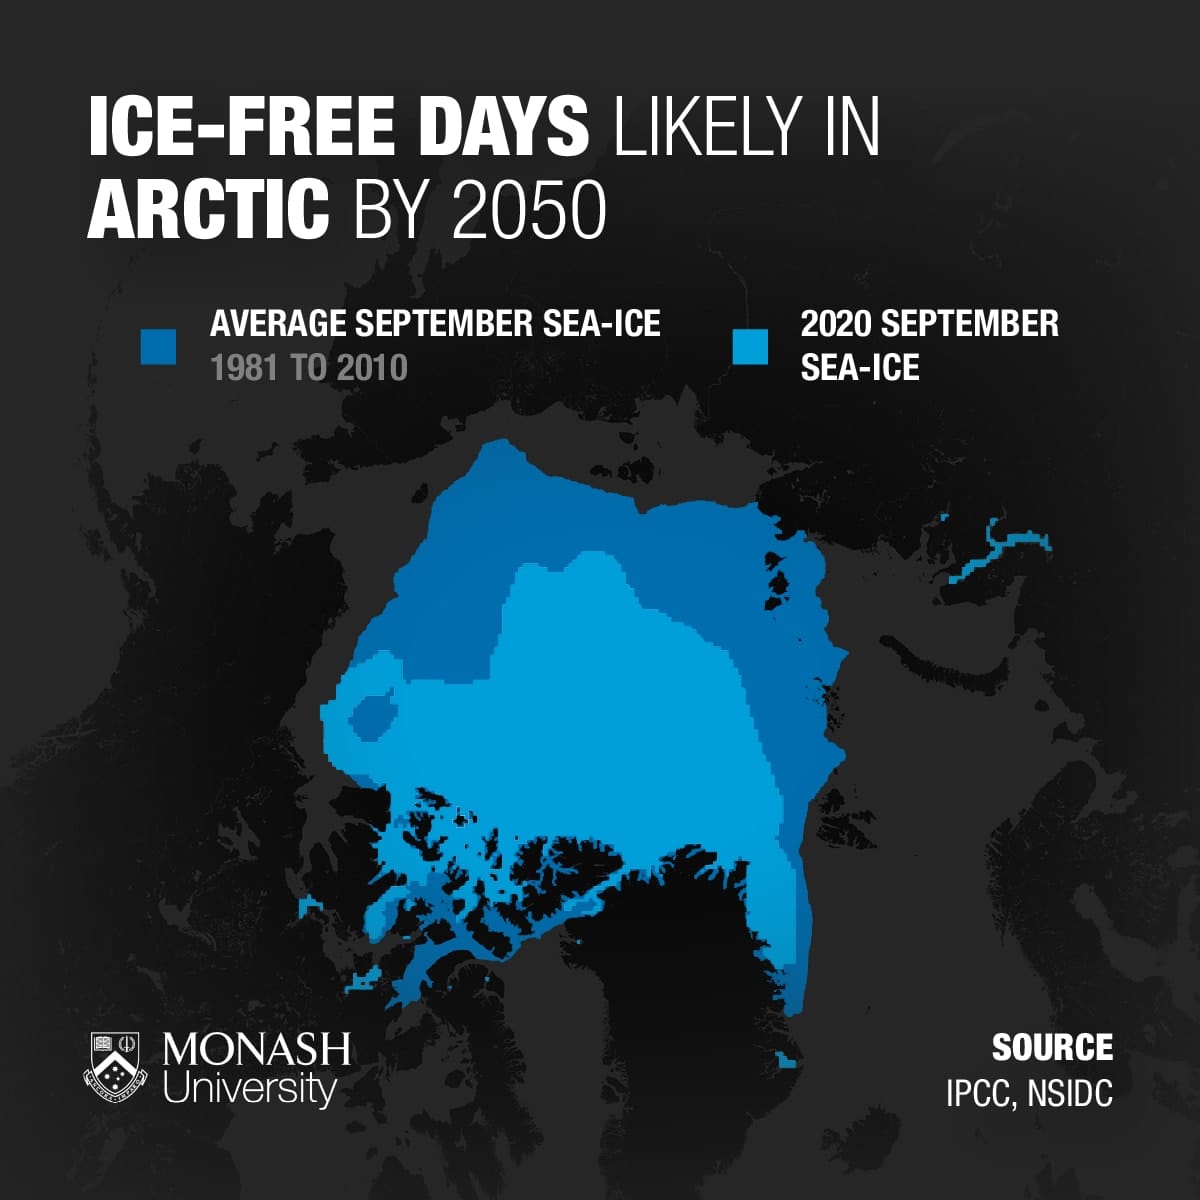
- the global retreat of glaciers since the 1990s and decreases in Arctic sea ice between 1979-2019
- global upper ocean (0-700m) heat content, which has warmed since the 1970s
- global mean sea level rise, which rose by 0.2m between 1901 and 2018, and is accelerating (it is rising almost three times as fast now as it was before 1971).
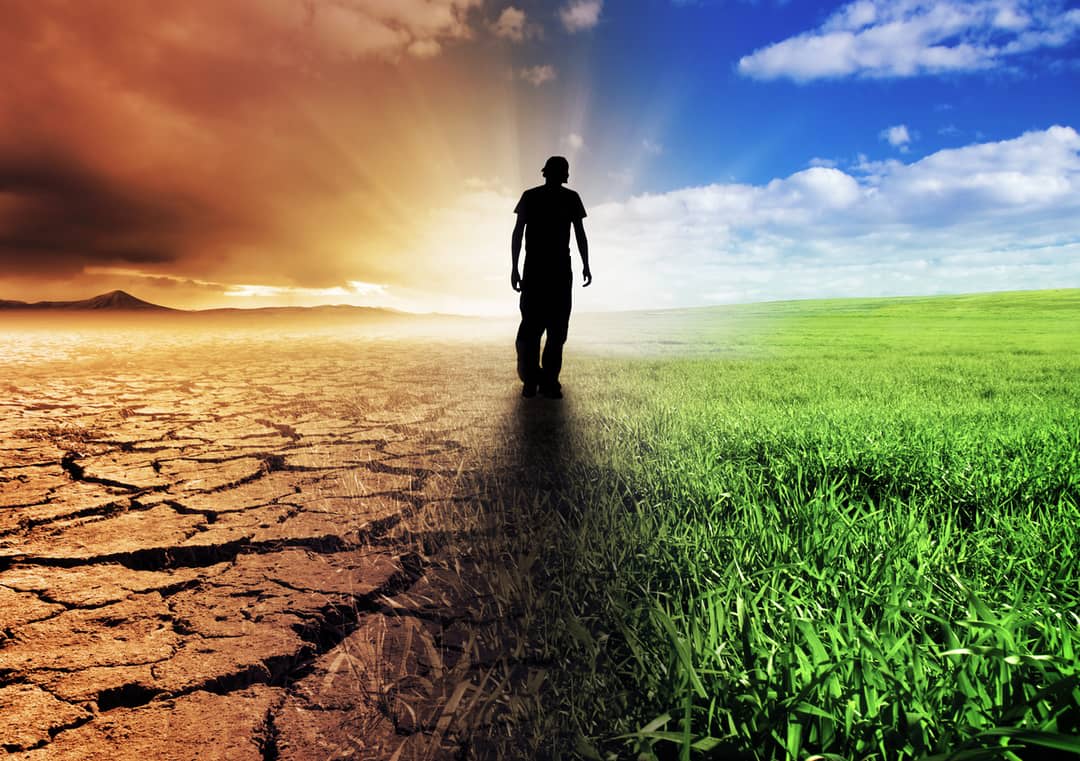
While this all may seem a little gloomy, what I identify as one of the most important outcomes of the entire report is that it’s still possible to limit global surface warming to 1.5°C, the temperature targeted by the Paris Agreement.
To get there, though, will require strong and rapid reductions in CO₂ methane and other greenhouse gases.
It’s worth noting that these reductions are not something that can be achieved in several years – it will take a sustained effort over several decades.
Remember, these human-released gases – particularly carbon dioxide, which has the longest lifetime in the atmosphere of the greenhouse gases – have been accumulating in our atmosphere for well over a century.
Understanding natural variability
My research largely focuses on understanding natural variability. This includes the impacts of modes of variability, such as the El Nino-Southern Oscillation, that present as changes in normal surface temperature over the central and eastern equatorial Pacific.
These modes are important, as they have downstream climatic effects, like waves rippling out from a rock thrown into a pond.
The “ripples” emanating from El Nino events can alter the rainfall around the globe, with specific impacts felt in North and South America, Australia, Asia, and even Africa.
You may think that understanding natural climate variability is worlds away from studying climate change. However, we now know that natural variability can impact global surface temperatures quite a bit, such that during short periods (less than 10-20 years) it can either counteract or enhance human-induced warming.
The impact of natural climate variability was clearly displayed during the past 20 years, as five-year averages of global temperature either side of 2008 (i.e, 2002-2007 and 2008-2012) only warmed by 0.015°C, while those either side of 2015 (i.e, 2010-2014 and 2015-2019) warmed by 0.23°C, approximately 15 time more.
However, we also know that the magnitude of natural variability typically decreases as the time period gets longer, such that it only has mild effects on multi-decadal and longer (30 years and longer) trends.
We now also know that that these natural surface temperature changes reflect changes in the distribution of temperature within the ocean (warm surface waters become transferred away from the surface, replaced by cooler subsurface water) only, as oceanic heat content and sea level rise continued even while surface temperatures did not change in this 2000-2012 period.
The consequences of inaction
This last point means that global warming, which is a response to the Earth's changing energy budget, still occurs in the absence of a strong surface expression.
My biggest concern is that fear of failure to limit warming to 1.5°C will lead to inaction. That is, the strong and rapid reductions in greenhouse gases that are required will not be implemented.
However, it’s worth noting that if limiting warming to 1.5°C is not achieved, we still want to limit the damage done and reduce the risks associated with climate changes, as every small increase in warming leads to more impacts.
So, 1.5°C is better than 1.6°C, and 1.6°C is better than 1.7°C.


